From Alerts to Kill Chains: Reconstructing Multi-Step Attacks in a Wazuh Lab
Learn how a Wazuh-based monitoring lab detects and correlates multi-step attacks. We walk through seven scenarios, from single actions to full kill chains, showing the telemetry, rules, and AI signals that piece the puzzle together.
 By admin
Updated October 29, 2026
In modern security operations, isolated alerts are noise; the true threat lies in the connected sequence of actions an attacker takes. Defenders need to move beyond single-event detection to reconstruct the full narrative of an intrusion. This article details a defensive lab project that integrates the Wazuh SIEM platform with network sensors and a machine learning classifier to do exactly that. You will learn how discrete events—from a simple port scan to a successful reverse shell—generate specific telemetry, trigger detection rules and AI signals, and are ultimately correlated into a coherent attack chain for analyst review. This walkthrough is from the defender’s perspective, focusing on the observable evidence and the logic that connects it.
All lab work described was conducted in a controlled, virtualized environment built with Docker. Such environments are essential for safe research and training and must be isolated from production networks.
Lab Architecture: A Multi-Layer Detection System
The monitoring system is built on a layered architecture designed to collect, detect, correlate, and visualize security events. At its core is a Wazuh 4.14.7 single-node cluster (Manager, Indexer, and Dashboard) deployed in containers. The primary target, an Ubuntu endpoint VM, runs the Wazuh agent, an Apache web server with DVWA, an OpenSSH server, and the Suricata network intrusion detection system. A separate Kali Linux VM simulates attack behaviors. A key component is an external AI and correlation processor, which runs a custom FlowMLP neural network model for classifying network flows and executes deterministic rules to link related events into attack chains.
Data flows from multiple sources: Wazuh agent logs (e.g., SSH authentication, web access), Suricata’s EVE JSON output (containing both alerts and flow records), and custom endpoint probes. These streams are normalized and analyzed by both rule-based engines (Wazuh and Suricata signatures) and the AI model. Results, including raw alerts, AI classifications, and synthesized attack chains, are forwarded back to the Wazuh Indexer for storage and displayed in a custom Attack Chain dashboard within the Wazuh Dashboard interface.
Detection Building Blocks: Rules, Signatures, and AI
Before examining scenarios, it’s crucial to understand the detection primitives. The system uses a hybrid approach, combining traditional signature-based detection with behavioral AI analysis.
Rule-Based Detection with Wazuh and Suricata
Wazuh’s detection is driven by rules, which have levels from 0 (ignored) to 15 (severe attack). The lab utilized both native Wazuh rules and 30 custom rules (IDs 119200–119225, 119250–119254) for specific scenario detection. For example, rule 119204 fires for repeated SSH authentication failures. Suricata provided network-level signatures, with custom rules like SID 9900003 to detect pure TCP SYN packets and SID 9900104 to detect HTTP request pressure.
AI-Based Flow Classification with FlowMLP
The FlowMLP model is a supervised Multilayer Perceptron neural network with 11,846 parameters. It takes a vector of 24 standardized statistical features extracted from a completed network flow—such as duration, packet counts, byte volumes, and protocol indicators—and classifies it into one of six classes:
- 0: BENIGN
- 1: FTP-Patator
- 2: SSH-Patator
- 3: Bot
- 4: PortScan
- 5: DDoS (displayed as DoS)
The model was trained on a dataset of 550,200 records, primarily from the CICIDS2017 dataset supplemented with 384 lab-generated BENIGN flows. Its output, a softmax probability distribution, is used to calculate an “attack score.” An alert is generated if this score exceeds a threshold set at the 99th percentile of the attack score observed on BENIGN validation data.
Custom Detectors and Correlation Logic
Beyond pre-built rules and AI, the system uses custom detectors with specific thresholds to identify suspicious behavior patterns from normalized event data. These detectors produce labels like possible_recon, repeated_auth_failures, and observed_reverse_shell. Correlation is performed using deterministic rules that link events based on common attributes—source/destination IP, time windows, session identifiers, and behavioral context—not merely temporal proximity. This process groups related events into “episodes” and then constructs potential “attack chains.”
Walking Through Single-Activity Scenarios
Each multi-stage attack begins with a single action. Understanding what these individual actions look like in telemetry is the first step to chain reconstruction.
| Scenario | What Was Detected | Primary Signals & Rules |
|---|---|---|
| 1. Nmap Reconnaissance | Scanning of multiple destination ports (1-32, 80, 443) using TCP connect scans. | Suricata SID 9900003 (SYN packets). Custom detector: possible_recon triggered by ≥20 distinct destination ports in 10 seconds. AI classification could label flows as PortScan. |
| 2. Hydra SSH Brute Force | Rapid, repeated failed authentication attempts against the SSH service. | Wazuh rules: 119208 (observed auth failures), 119204 (repeated failures), and native rule 2502. Custom detector: repeated_auth_failures (8 failures in 60s). AI classification could label flows as SSH-Patator. |
| 3. SYN Flood DoS on Web Port | A flood of TCP SYN packets directed at port 80. | Suricata alerts for numerous TCP SYN packets (rule 86601). Custom detector: syn_connection_pressure (≥100 unique SYN flows in 10s). AI classification could label flows as DDoS/DoS. |
| 4. SQL Injection Attempt | A UNION SELECT payload sent to a web application parameter. | Suricata signatures SID 9900101/9900102 matched the SQLi pattern in the request. Custom detector label: possible_web_sqli. |
In each case, the system generates discrete alerts. A reconnaissance scan might have a base risk score of 40, while repeated authentication failures score 65. Alone, these are noteworthy events. The power of correlation is revealed when these events are linked.
Correlating Events into Multi-Stage Attack Chains
The correlation engine monitors for events that share key attributes (like source and destination IP) and occur within defined time windows. When linked, they form an attack chain with a dynamically calculated risk score. The score is capped at 95 and is calculated as: R_chain = min(95; R_base + B_scan + B_diversity), where R_base is the highest base score of any stage in the chain, B_scan adds 10 if the chain started with reconnaissance, and B_diversity adds 5 if the chain contains more than one independent behavior group.
Chain Scenario 5: Reconnaissance to Denial-of-Service
This chain began with an Nmap scan (Scenario 1), followed within 90 seconds by a targeted SYN flood against port 80 (Scenario 3). The correlation logic linked these because they originated from the same source IP (172.20.0.4) and targeted the same destination IP (172.20.0.3) within the allowed time window.
The resulting chain, CHAIN-9B56140F9D00E395, contained two observed stages: reconnaissance (base score 40) and availability_pressure (base score 50). With the B_scan bonus added, the total chain risk score was 60, classifying it as a “Medium” risk incident. The dashboard visualized these two stages as a connected sequence, providing immediate context that a scan preceded a disruption attempt.
Chain Scenario 6: Reconnaissance to Test File Transfer
This scenario demonstrated linking scanning with post-compromise activity. After an initial Nmap scan, an EICAR anti-malware test file was transferred to the target via SCP over SSH. The Wazuh File Integrity Monitoring (FIM) component detected the new file, and a custom rule (87105) queried the VirusTotal API, which reported 65 antivirus engines detected the file.
The correlation engine built chain CHAIN-219A97BEFCAB7099. The EICAR transfer stage (test_file_transfer) normally has a base score of 40, but the positive VirusTotal result raised it to at least 75. Combined with the initial reconnaissance stage (score 40) and the B_scan bonus, the chain’s total risk score reached 85 (“High”). This shows how external threat intelligence can dynamically influence risk assessment within a chain.
Chain Scenario 7: Full Intrusion Kill Chain
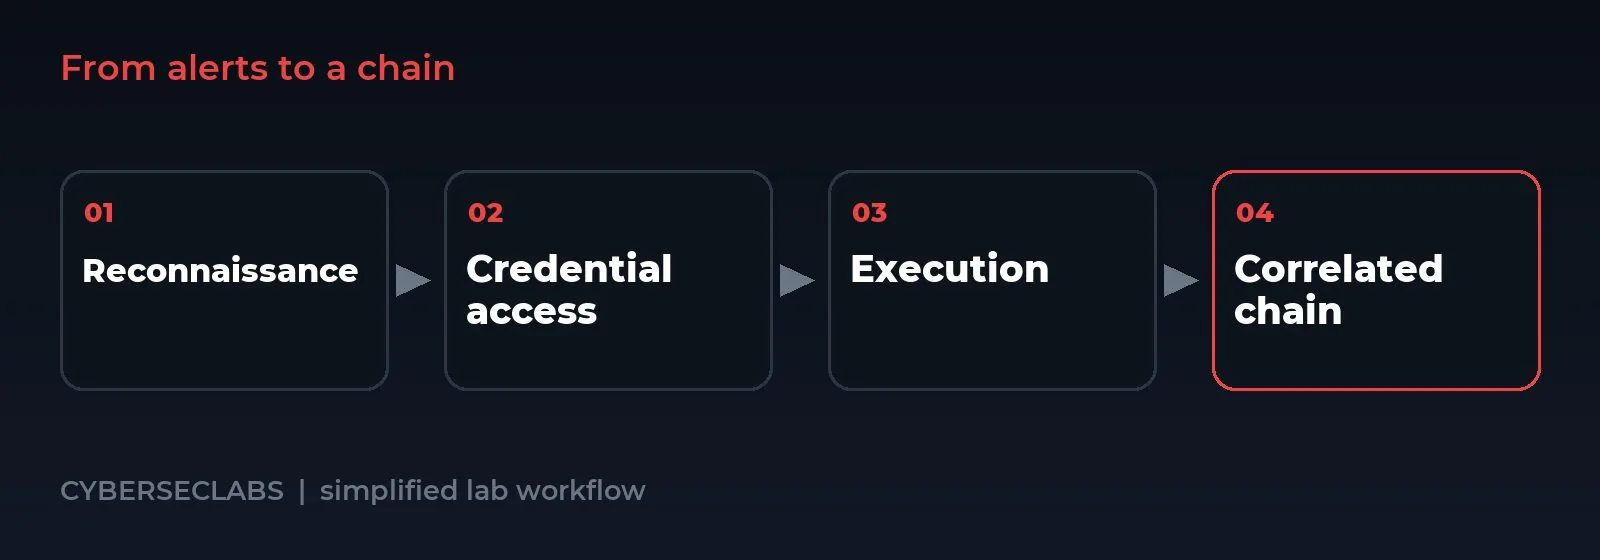
This complex chain simulated a complete intrusion: Reconnaissance (Nmap service detection) → Credential Access (Hydra brute-force leading to a successful login) → Execution (deployment and execution of a reverse shell payload). The correlation engine successfully linked these five distinct observed stages into a single chain, CHAIN-FC4E243C32C3631F.
The critical piece was the detection of the reverse shell. A custom detector identified this by verifying a shell process whose standard input and output were tied to a TCP socket established with the attacker’s IP. This triggered Wazuh custom rule 119222, a level 15 (critical) alert. With a base score of 95 for the observed_reverse_shell stage, the chain’s risk score hit the maximum of 95, labeled “Critical.” The dashboard presented this as a high-fidelity, high-priority attack narrative for immediate analyst action.
Visualizing the Chain in the Wazuh Dashboard
The integrated Attack Chain dashboard within the Wazuh interface provides the operational view for analysts. It lists chains by ID, source and destination IPs, risk score, number of stages, and behavior groups. Crucially, it distinguishes between observed stages (shown in green) and hypothetical next steps (shown with a yellow dashed label reading “CHƯA QUAN SÁT” – “Not Observed”). These suggested next steps are drawn from a pre-compiled table based on the final observed stage of a quiescent chain and are for analyst awareness only; they are not counted as evidence or included in the risk score.
Each chain is clickable, allowing analysts to drill down from the high-level narrative to the individual alerts, AI classification results, and ultimately to the raw log entries that form the evidence. This preserves full data provenance, enabling investigators to verify the detection logic and understand the context of each step.
Operational Considerations and System Limitations
While the lab demonstrates powerful correlation, its defensive use comes with important caveats. The FlowMLP model’s effectiveness is tied to its training data; a softmax score of 0.9 for the “SSH-Patator” class indicates model confidence, not a 90% probability of a successful breach. Correlation is based on deterministic rules and may generate false chains if unrelated events coincidentally share attributes.
Observation gaps exist: the process observer scans every 100 milliseconds and may miss ephemeral processes, and Suricata may drop packets under heavy load. A reconstructed chain is a hypothesis for investigation, not definitive proof of a coordinated attack. The risk score is a lab-defined policy tool for prioritization, not a calculated probability of compromise. Finally, this is a monitoring and analysis system; it does not perform automated blocking or incident response.
Key Takeaways
- Correlation Transforms Alerts into Intelligence: Isolated alerts from Wazuh, Suricata, and AI are valuable, but linking them across time and context reconstructs the attacker’s story, turning data into actionable intelligence.
- Hybrid Detection Provides Depth: Combining signature-based rules (for known patterns) with AI-based behavioral analysis (for novel or subtle anomalies) creates a more robust and comprehensive detection capability.
- Preserve Data Provenance: A functional SOC system must maintain clear links from high-level attack chains down to the raw log events, allowing analysts to verify alerts and understand root causes.
- Visualization is a Force Multiplier: An Attack Chain dashboard that clearly distinguishes observed actions from predicted next steps helps analysts quickly triage incidents and understand potential scope.
- Understand the Limits: Recognize that detection does not equal prevention, AI confidence scores are not probabilities, and correlated chains are investigative hypotheses that require human validation.
Related reading: Wazuh and AI: Anomaly Detection and Event Correlation Explained
Frequently Asked Questions
How does the AI model (FlowMLP) differ from traditional Suricata signatures?
Suricata signatures match specific, predefined patterns in network traffic (e.g., a string of SQL keywords). FlowMLP, in contrast, analyzes statistical features of a completed network flow—like duration, packet size distribution, and byte ratios—to classify its behavioral pattern. It can potentially detect novel attacks that don’t match a known signature but exhibit statistical anomalies compared to benign traffic, such as certain types of scanning or brute-forcing.
What prevents unrelated events from being falsely correlated into a chain?
The correlation engine uses deterministic rules that require more than just a shared IP address. It links events based on a combination of attributes including source/destination IP, time proximity within defined episode windows (e.g., a new episode starts after 90 seconds of silence), and behavioral context. For example, a scan and a later login attempt from the same source would be linked, but random, low-volume events from a common IP (like a web server) over a long period would not form a chain.
Why is the risk score for a chain capped at 95, and what does a u0022Criticalu0022 score mean?
The cap at 95 is a lab policy design choice to leave headroom for even more severe, hypothetical scenarios. A u0022Criticalu0022 score of 95 is assigned automatically when the chain contains a stage with a base score of 95, such as observed_reverse_shell. This score is a prioritization signal, indicating that the chain contains evidence of a high-impact behavior like remote code execution, warranting immediate investigation. It is not a measure of attack success probability.
Can this system automatically block an attack in progress?
No. The described system is focused entirely on monitoring, detection, analysis, and visualization. It does not include an automated response or blocking component. Its purpose is to augment human analysts by correlating alerts and presenting a coherent attack narrative, enabling faster and more informed manual response decisions. Integrating such a detection system with a firewall or endpoint response platform would be a separate implementation step.
About the author

admin writes reviews and buying guides for CyberSecLabs.